Financial and Insurance Services - Economics and Employment
Explore the sector's economic data which highlights the contribution to the local economy on the Sunshine Coast.

The Financial and Insurance Services Industry is a cornerstone of the Sunshine Coast’s evolving economy, providing essential services that support both individual prosperity and business growth. As the region continues to diversify and modernise, understanding the performance and characteristics of this sector is vital for informed planning and investment.
This article offers a snapshot of the industry’s current contribution to the local economy, workforce profile, and business landscape. It draws on the latest data to highlight key trends in productivity, employment, qualifications, and income distribution. Guided by the Sunshine Coast Regional Economic Development Strategy (REDS, the region is committed to building a resilient, future-ready economy—one in which the Financial and Insurance Services sector plays a growing and strategic role.
Industry productivity
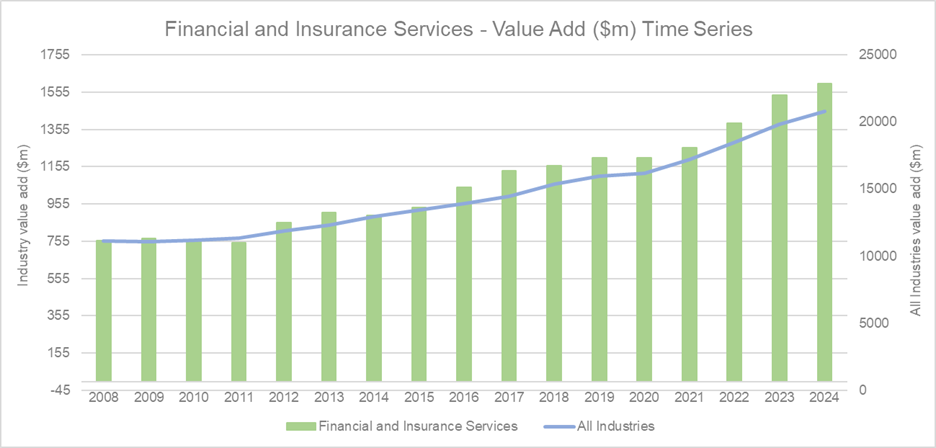
Source: National Institute of Economic and Industry Research (NIEIR) 2024. Compiled and presented by economy.id
The Financial and Insurance Services Industry has demonstrated a consistent upward trajectory in productivity over the past decade as illustrated by the time series graph. The green bars, representing the sector’s annual value add, show steady growth with minor fluctuations, culminating in a 4.0% increase from 2023 to 2024. This positive trend highlights the sector’s resilience and expanding role within the regional economy. Currently, the industry contributes approximately 7.7% of the total value added by all industries on the Sunshine Coast. The broader economy, represented by the blue line, also shows sustained growth, indicating a healthy and supportive environment for continued sectoral expansion.
Industry workers qualifications
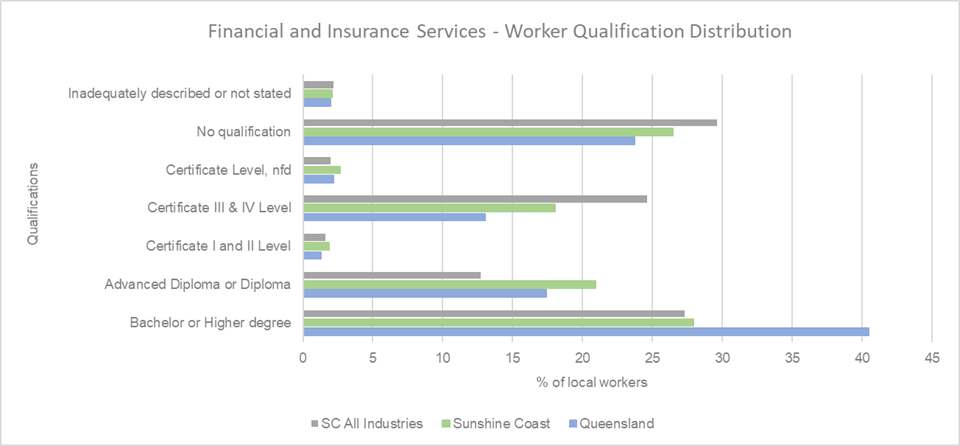
Source: Australian Bureau of Statistics, Census of Population and Housing 2021. Compiled and presented by economy.id)
The qualifications profile of workers in the Financial and Insurance Services Industry reveals a workforce with strong emphasis on higher education. The graph shows that Bachelor or Higher Degree qualifications represent the largest share of workers in this sector, exceeding the Sunshine Coast average across all industries and the Queensland average. This indicates a high level of professional and academic training within the industry, reflecting its specialised and knowledge-intensive nature. Certificate III & IV and Diploma or Advanced Diploma, also show moderate representation, though they trail behind the broader regional averages. These trends align with the Sunshine Coast Regional Economic Development Strategy (REDS), which prioritises workforce development and skills enhancement to support economic resilience and innovation.
Total employment time series
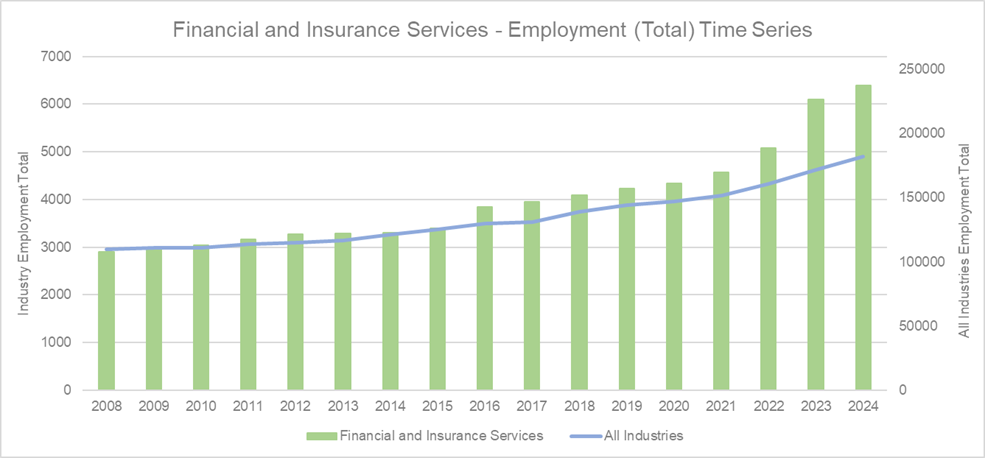
Source: National Institute of Economic and Industry Research (NIEIR) 2024. Compiled and presented by economy.id
Employment in the Financial and Insurance Services Industry on the Sunshine Coast has shown a strong upward trend, particularly in recent years. The graph illustrates a relatively stable employment level from 2008 to 2016, followed by a noticeable rise beginning in 2021 and accelerating significantly by 2023. This growth culminated in a 4.8% increase in employment from 2023 to 2024, reflecting renewed momentum and expansion within the sector.
Currently, the industry accounts for approximately 3.5% of total employment across all industries in the region, indicating a meaningful and growing presence in the local labour market. The recent surge in sector-specific employment may be driven by increased demand for financial services, digital transformation, and population growth, all of which has contributed to the sector’s expanding footprint.
Export and local sales
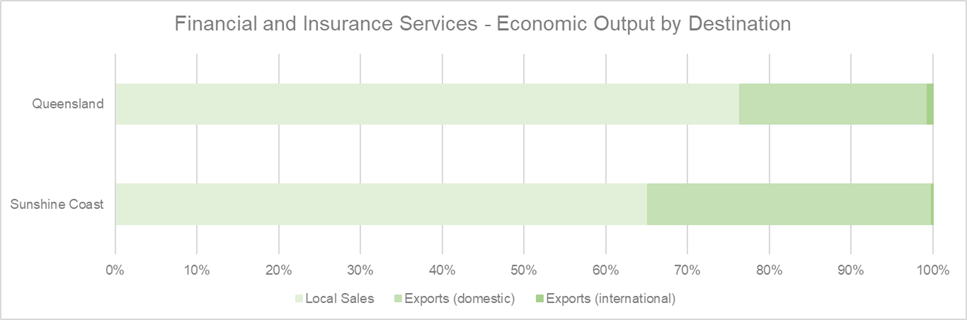
(Source: National Institute of Economic and Industry Research (NIEIR) 2024. Compiled and presented by economy.id)
The Sunshine Coast’s Financial and Insurance Services Industry exhibits a distinct economic output profile compared to Queensland overall. Local sales in the region make up a smaller share of the sector’s output by 11.2% compared to Queensland’s broader output, indicating a relatively reduced reliance on local market activity. In contrast, domestic exports are significantly more prominent, accounting for 11.83% higher output than the state average. This suggests that the Sunshine Coast industry is more outward-facing within the national market, potentially benefiting from regional specialisations or inter-regional service demand.
International exports, however, remain slightly below the Queensland benchmark, at 0.56% lower, indicating limited global market penetration. While the Sunshine Coast’s financial and insurance services sector demonstrates strong national connectivity, there is room to grow its international presence. Strategic initiatives aimed at enhancing export capabilities—particularly global outreach—could help diversify market exposure and strengthen the sector’s resilience in a competitive economic landscape.
Employee age and gender distribution
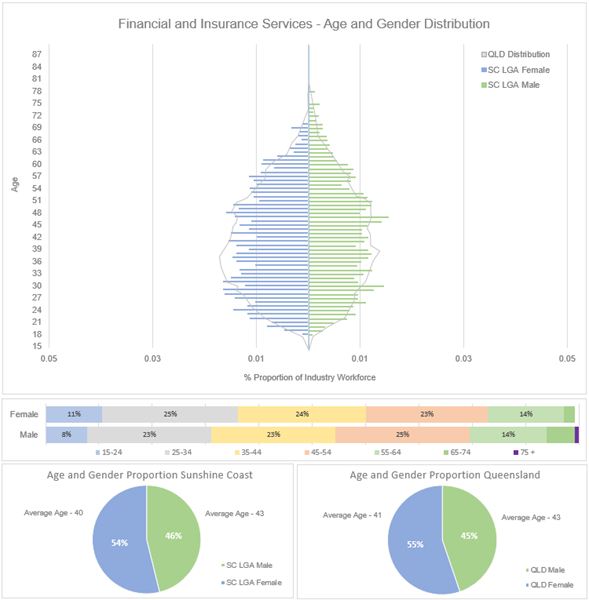
(Source: ABS Table Builder 2025, 2021 Census - employment, income, and education)
The age and gender distribution of workers in the Financial and Insurance Services Industry reveals a unique demographic profile compared to Queensland. The Sunshine Coast has a higher proportion of both younger workers (ages 15–24) and older workers (ages 65–74), while middle-aged workers (35–54) are underrepresented relative to the state average. This pattern may present short-term workforce challenges, such as experience gaps or succession planning needs, but it also suggests a positive long-term outlook with a pipeline of younger talent entering the industry.
The average age of workers on the Sunshine Coast is 40 years, slightly younger than Queensland’s 41 years, reinforcing the region’s appeal to early-career professionals. Gender distribution is relatively balanced, with males making up 54% and females 46% of the local workforce—closely mirroring the state’s composition. These insights highlight the importance of targeted workforce development strategies to support generational renewal and ensure the industry remains resilient and adaptable.
Industry business distribution
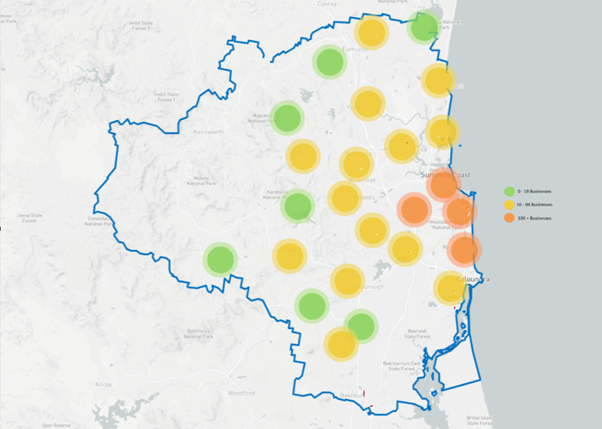
(Source: ABR 2025)
The heat map illustrates the geographic distribution of Financial and Insurance Services businesses across the Sunshine Coast, revealing a strategically concentrated presence in key urban and coastal areas. Most regions are marked with yellow circles, indicating a moderate density of 10 to 100 businesses, suggesting a widespread but balanced footprint across the region. A notable orange cluster appears in central coastal zones, likely corresponding to major commercial hubs such as Maroochydore or Caloundra, where proximity to population centres and infrastructure supports higher business activity.
Scattered green markers across inland and fringe areas reflect smaller pockets of financial and insurance services, showcasing the sector’s adaptability to both urban and semi-rural settings. This distribution highlights the importance of regional connectivity and access to professional services, aligning with the Sunshine Coast Regional Economic Development Strategy (REDS) goals of fostering inclusive and accessible economic growth.
Disclaimer: ABS employment Data has this information grouped by larger selected suburbs. Smaller suburbs feed into the data set of these selected suburbs.
Employee income distribution
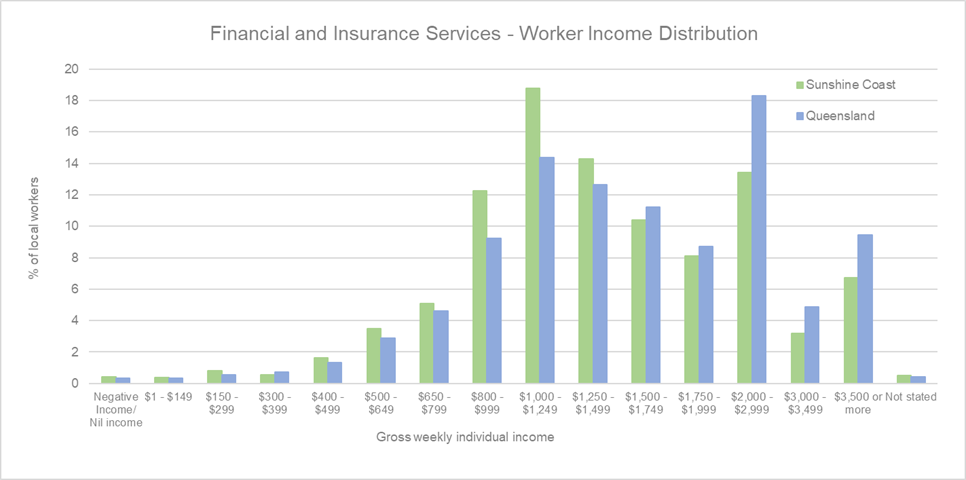
(Source: Australian Bureau of Statistics, Census of Population and Housing 2021. Compiled and presented by economy.id)
The income distribution of workers reveals a concentration in the mid-income brackets, with notable differences compared to Queensland. Approximately 43% of workers earn under $1,249 per week, with the largest group—18.8%—earning between $1,000 and $1,249. This suggests that while the industry provides stable employment, a significant portion of the workforce falls within modest earning ranges.
Compared to Queensland, the Sunshine Coast shows a higher proportion of workers in the $800–$1,249 range, but fewer in the higher income brackets above $1,500. This may reflect regional differences in job roles and business scale. The relatively lower representation in top income categories could pose challenges in attracting and retaining highly skilled professionals. Addressing this through targeted wage growth, career development pathways, and upskilling initiatives could help improve income equity and support long-term workforce sustainability in the region.
Conclusion
The Financial and Insurance Services Industry on the Sunshine Coast is demonstrating strong and sustained growth, with rising productivity and employment contributing significantly to the region’s economic performance. The sector now accounts for 7.7% of total value added and 3.5% of employment, reflecting its expanding influence.
A highly educated workforce, with a strong representation of Bachelor and higher degrees, positions the industry well for innovation and professional service delivery. Demographic trends show a promising influx of younger workers alongside a stable older cohort, suggesting long-term sustainability despite short-term generational gaps.
The region’s businesses are well-distributed, with key concentrations in urban centres, and the sector shows strong national market engagement through domestic exports. While income levels are concentrated in mid-range brackets, there is potential to enhance career pathways and wage growth.
Aligned with the Sunshine Coast Regional Economic Development Strategy (REDS), the Financial and Insurance Services sector is well-positioned to continue driving regional prosperity through strategic investment, workforce development, and market expansion.
Resources and support
Disclaimer
Information contained in this correspondence is based on available information at the time of writing. All figures and diagrams are indicative only and should be referred to as such. While the Sunshine Coast Regional Council has exercised reasonable care in preparing this information it does not warrant or represent that it is accurate or complete. Council, its officers, and contractors accept no responsibility for any loss occasioned to any person acting or refraining from acting in reliance upon any material contained in this document. Any forecasts or projections used in the analysis can be affected by a number of unforeseen variables, and as such no warranty is given that a particular set of results will in fact be achieved. Sunshine Coast Regional Council has referenced a range of data sources to compile this information including the Australian Bureau of Statistics, Queensland Government Statistician’s Office, Tourism Research Australia, Economy Id and the National Institute of Economic and Industry Research. While every care has been taken to ensure the content is accurate, there may be errors or omissions in it and no legal responsibility is accepted for the information.