REDS 2013-2033: 10 years of progress
The Sunshine Coast Regional Economic Development Strategy 2013-2033 (REDS) has delivered a 20-year vision and blueprint for sustainable economic growth. Now at the strategy’s midpoint, Council endorsed REDS 2023 Refresh. The refreshed strategy assesses the progress made, considers important developments and provides an updated framework to continue the transformative journey.
The Sunshine Coast Regional Economic Development Strategy 2013-2033 (REDS) has delivered a 20-year vision and blueprint for sustainable economic growth.
Now at the strategy’s midpoint, on 26 October 2023 Council endorsed the REDS 2023 Refresh. The refreshed strategy assesses the progress made, considers important developments and provides an updated framework to continue the transformative journey to 2033.
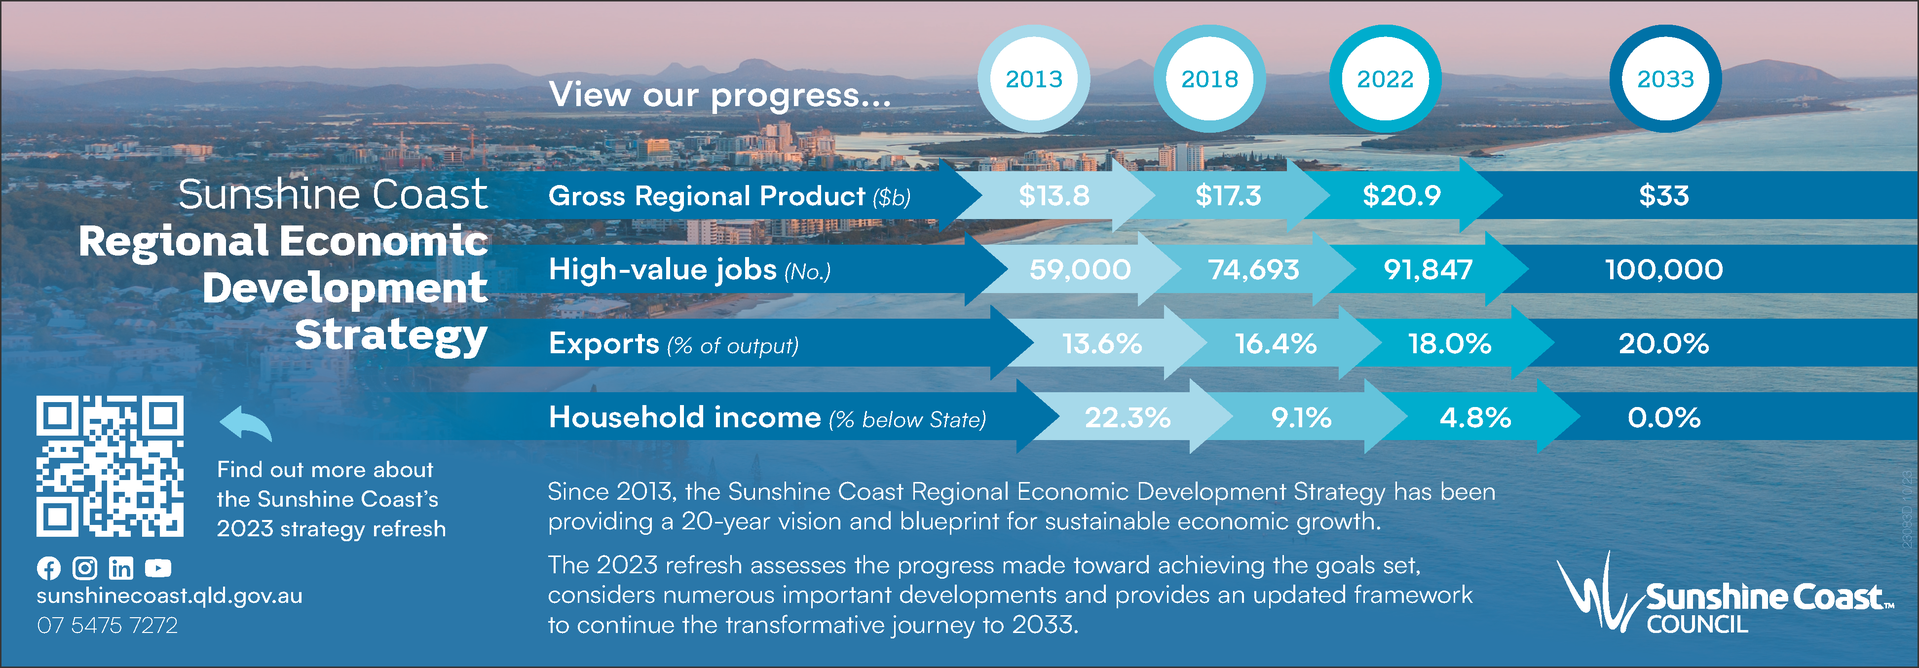
In this article we delve into the data underlying the region’s 10-year progress. With data, the Sunshine Coast will be compared to state and national averages. Industry figures will also be highlighted to demonstrate the 10-year journey.
Gross Regional Product (GRP)
From 2001 to 2011, Sunshine Coast and Queensland’s cumulative GRP trended similarly with steady proportional growth. Over this period, The Sunshine Coast saw an increase of 63 per cent with Queensland experiencing a 53 per cent increase over the same period. From 2013, the cumulative change in GRP on the Sunshine Coast increased exponentially, diverging from the Queensland trend. The Sunshine Coast region saw a further 97 per cent increase from 2012 to 2021, compared to the 40 per cent increase experienced by Queensland.
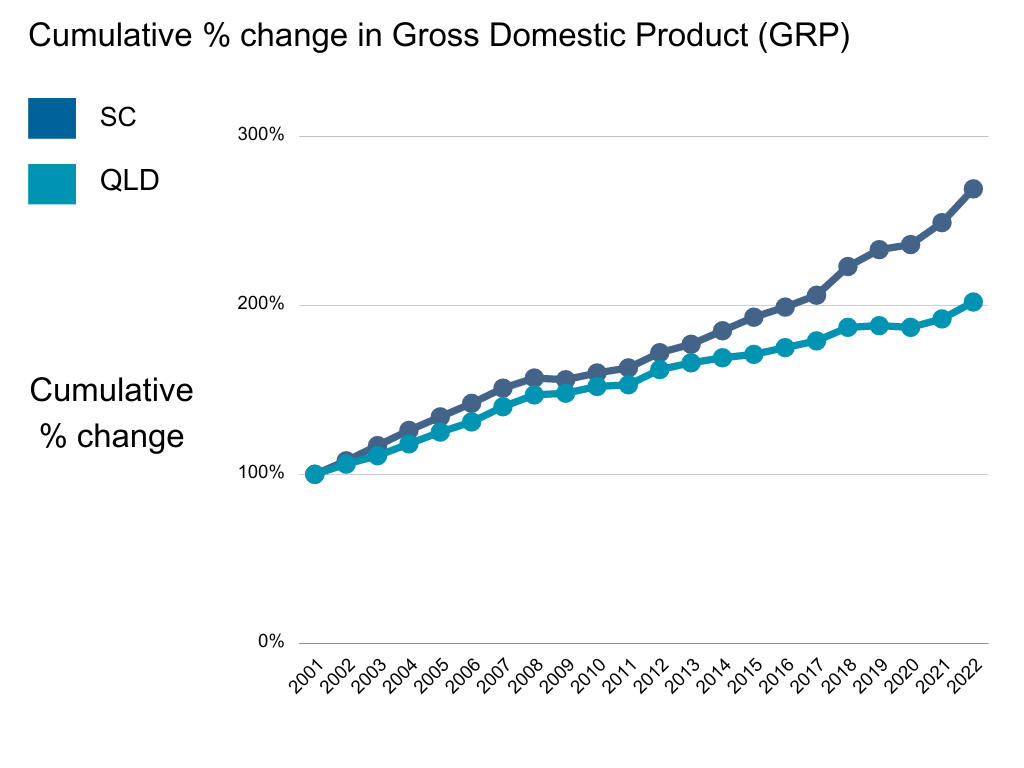
Source: Economy.id 2023
Population
The Sunshine Coast’s population change increased steadily across the first 10 years of the REDS (2013-2022). Annual increases over this period ranged from 2.31 to 2.95 per cent. In 2021, COVID-19 impacted overall populations dramatically across Queensland and nationally resulting in significant reductions in annual population change. Despite this, the Sunshine Coast maintained its steady historical population growth throughout and continued post the pandemic period. This has seen an influx of a new skilled workforce and business migration to the region. Conversely, pressure has been placed on housing and infrastructure in the region as outlined in the REDS Refresh.
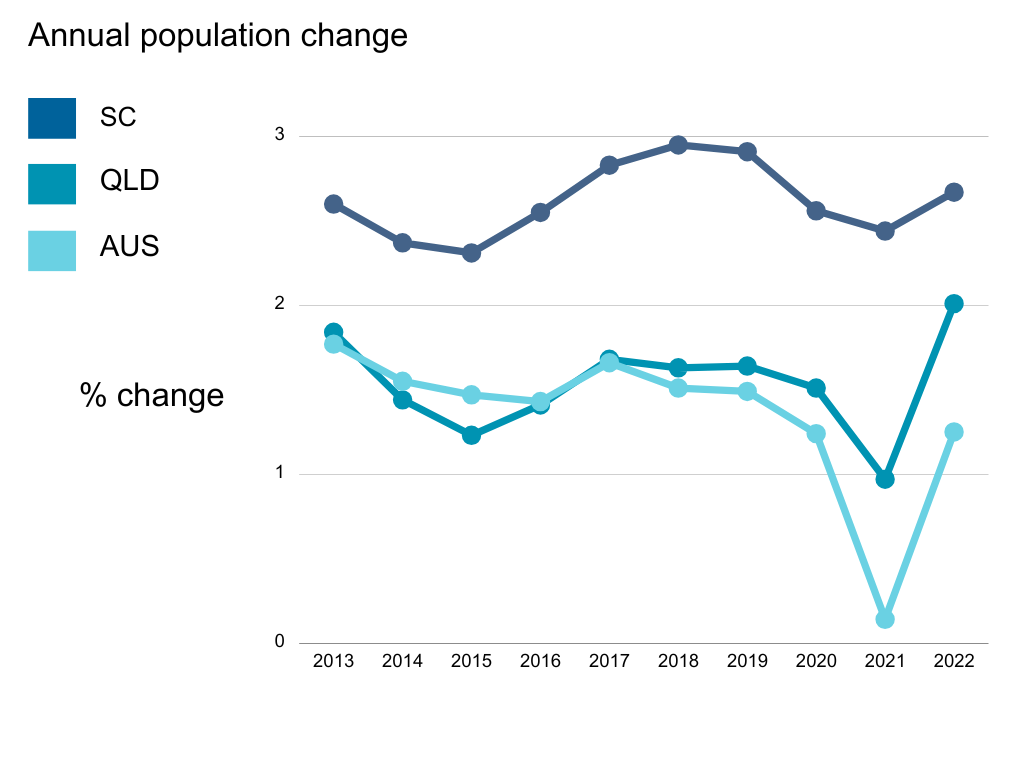
Source: Economy.id 2023
Employment
Employment in the Sunshine Coast region grew steadily over the past 10 years. Health Care and Social Assistance has seen the most significant growth in employment, having increased by 80.55 per cent over this period, contributing 24 per cent of total employment on the coast. The Sunshine Coast University Hospital contributed to this substantial growth. Education and Training also grew significantly over this period with jobs increasing by 64.75 per cent.
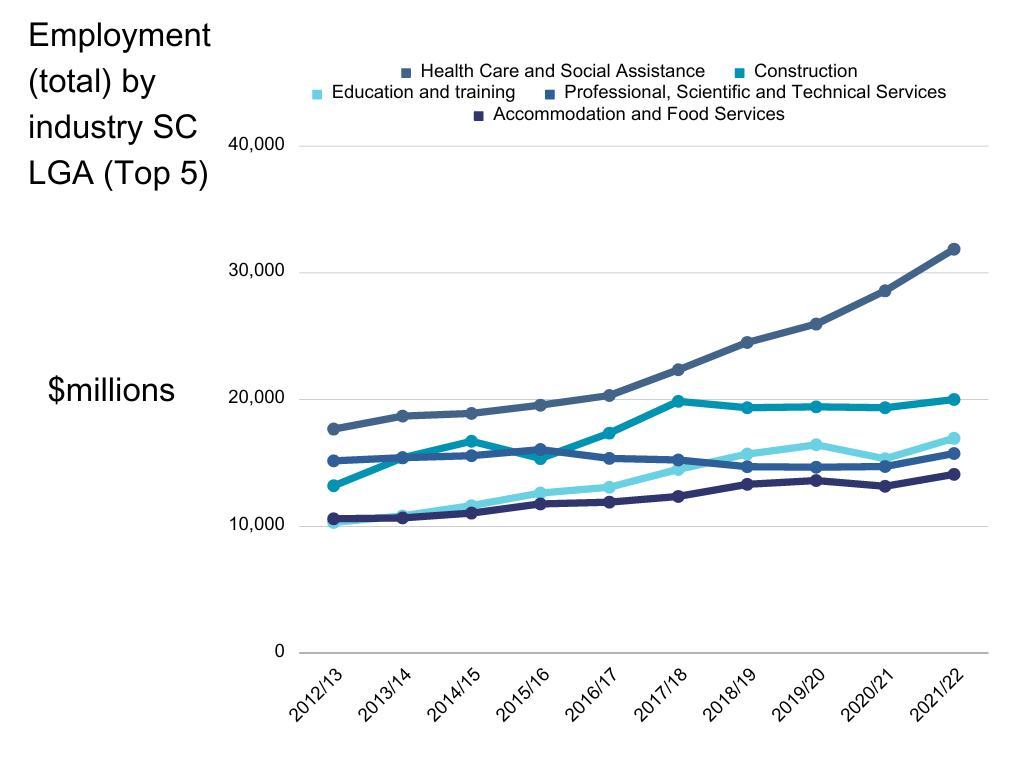
Source: Economy.id 2023
Value added to the economy by industry
Value added by industry indicates the productivity of each industry on the Sunshine Coast. It shows how effective each industry sector is at increasing the value of its inputs. Investment and talent attraction has led to increased value added by these industry sector. The Professional, Scientific and Technical Services industry in particular saw exceptional growth over the past 10 years with value added increasing from $720.2 million in 2013/14 to $1.287 billion in 2021/22. Health Care and Social Assistance was the region’s most productive industry in 2021/22, generating $2.491 billion.
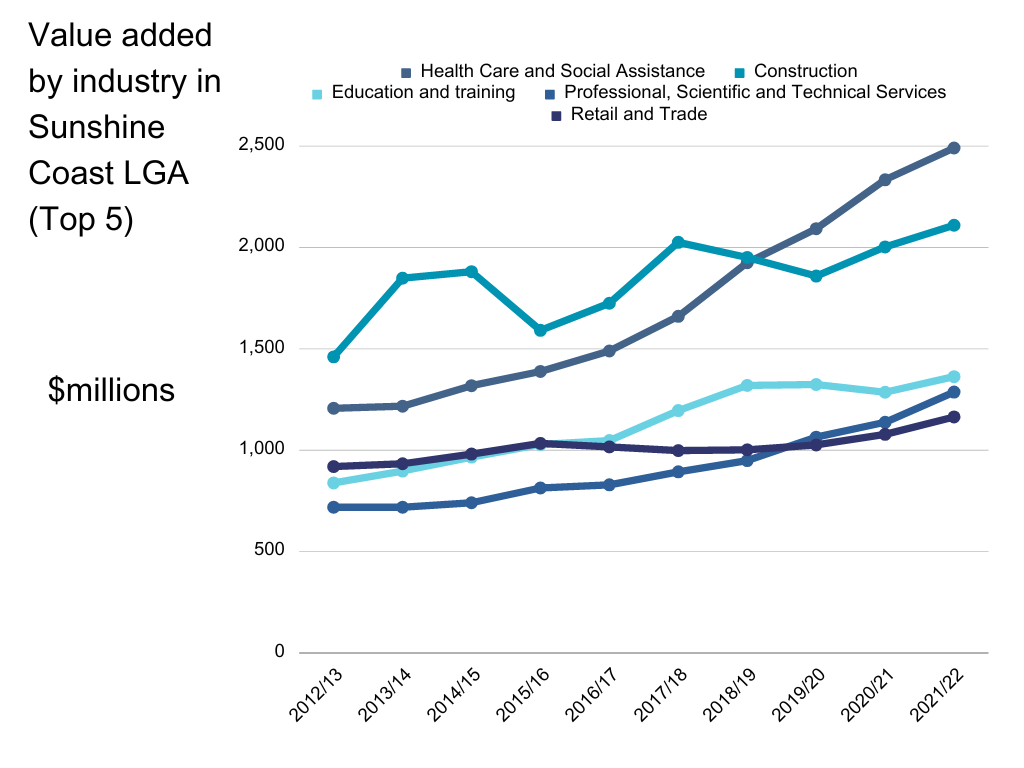
Source: Economy.id 2023
Exports
The REDS outlined ‘Local-to-Global Connections’ as an essential pathway to achieve the strategy’s 2033 goals. Sunshine Coast export industries such as Manufacturing have seen substantial growth in exports over the period. Manufacturing exports growth grew from $769.3 million in 2012/13 to $1.126 billion in 2021/22, experiencing exponential growth from 2019/20 onwards. An honourable mention to Agriculture, Forestry and Fishing exports which was not in the top five but has seen considerable growth since 2019/20 to 2021/22. The industry experienced a 156 per cent increase in export revenue during that period.
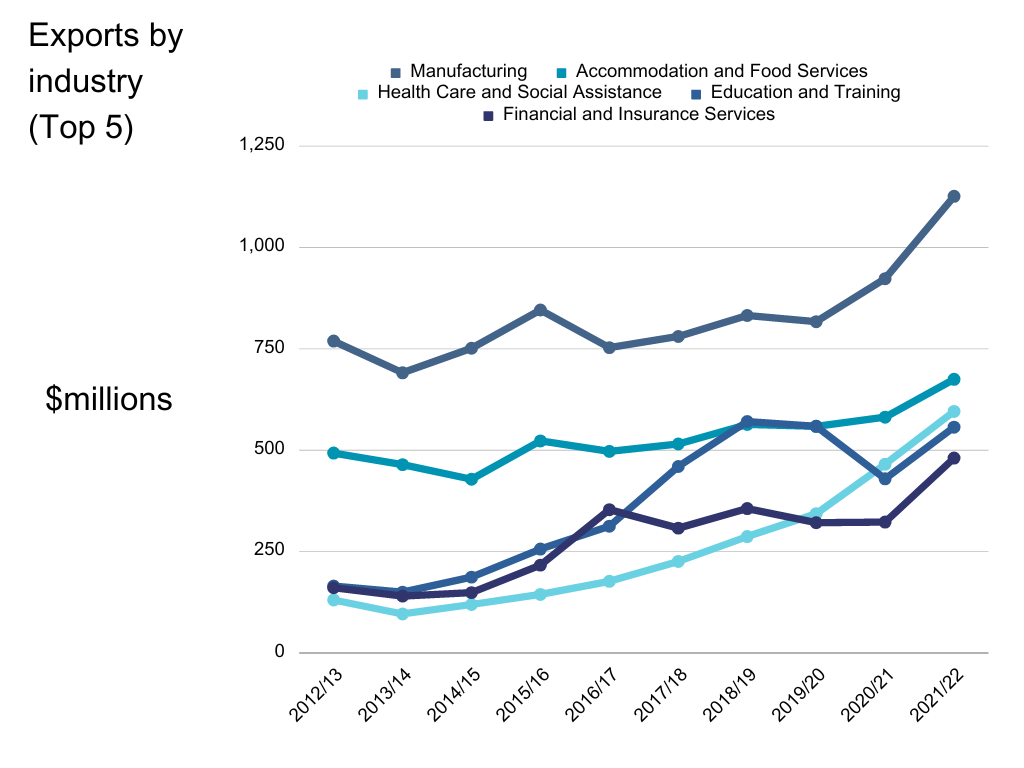
Source: Economy.id 2023
Conclusion
The Sunshine Coast has experienced region-shaping change since the REDS implementation 10 years ago. The REDS introduced a blueprint for sustainable economic growth, and with support and contribution from stakeholders in governmnet, industry and education, the region has progressed towards the 2033 goals. Informed by the last 10 years, the REDS Refresh sets out a clear path for a new economy on track to generate thousands of jobs, higher local wages, plus expansion of the Sunshine Coast’s high-value industries.
Disclaimer: Information contained in this correspondence is based on available information at the time of writing. All figures and diagrams are indicative only and should be referred to as such. While the Sunshine Coast Regional Council has exercised reasonable care in preparing this information it does not warrant or represent that it is accurate or complete. Council, its officers, and contractors accept no responsibility for any loss occasioned to any person acting or refraining from acting in reliance upon any material contained in this document. Any forecasts or projections used in the analysis can be affected by a number of unforeseen variables, and as such no warranty is given that a particular set of results will in fact be achieved. Sunshine Coast Regional Council has referenced a range of data sources to compile this information including the Australian Bureau of Statistics, Queensland Government Statistician’s Office, Tourism Research Australia, Economy Id and the National Institute of Economic and Industry Research. While every care has been taken to ensure the content is accurate, there may be errors or omissions in it and no legal responsibility is accepted for the information.